


NewsInformation Center
EFFECT OF TEMPERATURE ON THE STRUCTURE AND FILTRATION PERFORMANCE OF POLYPROPYLE
2020/07/10
Share:
IntroductionEmerging environmental problems, especially ne particle pollution (<2.5 mm, promulgated by the US Environmental Protection Agency) can cause great harm to human health such as to respiratory tract and extra pulmonary organs [1-4]. Currently, air ltration is one of the most direct and effective methods for resolving particulate pollutants, and the key is air ltration materials. There are many varieties of nonwoven lter materials, and the diversity of the production process makes it applicable to different elds [5]. Melt-blown nonwoven materials are widely used in air ltration because of their ne bers, large surface area, high porosity, and good ltration characteristics [6-8].At present, the research on how to improve the ltration performance of melt-blown nonwovens mainly focuses on two aspects. One is improved from the structure of nonwoven fabric [4, 9]. Deng et al. [3] successfully fabricated multi-scale micro/nanobers membrane by one-step melt-blown technique. Soltani and Macosko [9] used the islands-in-the-sea approach to prepare nanober melt-blown nonwovens. However, these methods have some shortcomings such as having large ltration resistance and increasing energy consumption. The other is combined with electret technology. Electret technology is an electric eld poling method that via a corona charging system with adjustable electric eld provides charge to fabrics. Electret lters not only include the traditional dust trapping way (interception effect, inertance effect, diffusion effect, gravity effect) but also can absorb dust particles by electrostatic force (electrostatic effect) [10-12]. It has been broadly demonstrated that electret lter material with electrostatic charges added on bers will improve particle collection efciency without increasing the ltration resistance [13-15]. There are plenty of research for corona charging. Shu et al. [16] studied the electret technology of air ltration material and found that charging voltage, followed by charging speed and distance, are the main factors to affect the ltration efciency. Brochocka et al. [17] used polypropylene (PP) admixed with additives with varying electrostatic potentials, and the results proved that electrostatic forces of nonwovens are strengthened. Chang et al. [18] developed a two-layer charged composite lter and found that it had a high gure of merit and a better holding capacity for PM2.5 (particle size < 2.5 mm). However, few studies have been done on combining corona charging with temperature. Zhang et al. [19] investigated the electromechanical performance of cellular PP electrets charged at a high temperature (≥100°C). Ji et al. [20] studied the charge storage and its stability of corona-charged PP nonwoven fabric treated with a high temperature (≥90°C), and the results showed that charge storage and its stability were improved. However, little attention was paid to the effect of electret temperature on structure and ltration performance of PP melt-blown nonwovens. According to Zhong-Bao J’s research, we assumed that charged at a high temperature (≥70°C), PP melt-blown nonwovens may increase their ltration efciency.Herein, in this report, we applied the method of simultaneous corona-temperature treatment, that is to say, applying external temperature treatment while polarizing. The simultaneous corona-temperature treatment rst activates the dipole in the dielectric material at a high temperature (≥70°C). Under the action of the electric eld force, the dipoles are aligned along the direction of the electric eld, and the electric eld is maintained until the dielectric material is cooled to a certain low temperature, so that the originally activated dipole inside dielectric material is frozen, and in addition, a complicated charging phenomenon may occur between the electrode and the dielectric material under the action of an applied electric eld. The electret thus formed contains a space charge and a dipole charge [21].The material has a specic melting point, and it requires a certain amount of energy to accelerate its chemical structure change and increase the quantity of formed dipole within the electrets. Considering the integrity of the fabric, we choose a temperature range of 70–110°C. Therefore, we chose corona charging fabric as the control group; the other groups were treated with the simultaneous corona temperature. Here the effect of electret temperature (the temperature applied during the electret process is called electret temperature) on structure and ltration performance was investigated. At this time, corona charging fabric was charged under indoor condition without external temperature, and for the convenience of discussion, we would mark the electret temperature of corona charging fabric as room temperature. The only difference between all samples was the difference in the electret temperature.
2. Materials and methods
2.1. MaterialsThe raw material used was modied PP with a melt index of 1500 g/min. On the same bases of the melt-blown process and electret process and changing electret temperature, ten kinds of sample were fabricated. The melt-blown PP electret fabrics were produced using the melt-blown installation in Zhejiang Zhaohui Filter Technology Co. Ltd. We chose corona charging fabric (room temperature) as the control group; the other groups were treated with the simultaneous corona temperatures of 70, 75, 80, 85, 90, 95, 100, 105, and 110°C. Indewlling time in the corona chamber was 5 seconds, and the winding speed was 26 Hz.2.2. MethodsThe electret samples were formed via a corona charging system with the adjustable electric eld to provide charge to PP fabrics [22]. When corona poling was performed at room temperature, the corona system was not heated. For the convenience of discussion, we recorded the room temperature as 20°C. Schematic diagram of the corona charging system is shown in Figure 1.The surface morphology of samples was observed using a scanning electron microscope (JSM-5610LV, Japan). The ber diameters were calculated using the software Image J by measuring 100 bers using the scanning electron microscope (SEM) images.The pore structure of samples was investigated using a capillary ow porometer (CFP-1100-AI, Porous Materials Inc., USA) based on the bubble point test.
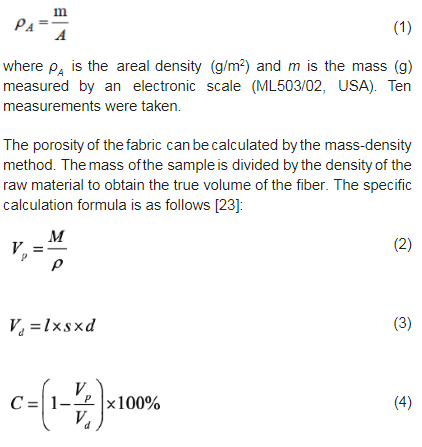
The thickness of samples was investigated using digital fabric thickness gauge (YG(B)141D, China) according to the test standard: “GB T 24218.2-2009 Textile nonwoven fabric test method Part 2 thickness determination”. Ten measurements for each sample were carried out.The area density is the mass per unit area. The areal density of samples was calculated according to equation (1):
In equation (2), M is the average mass of the sample (g), ρ is the density of raw material (g/cm3), and Vd is the absolute volume (true volume) of the ber in the fabric (cm3). In equation (3), l is the sample length (cm), S is the sample width (cm), d is the thickness (cm) of the sample measured at a specied pressure, and Vd is the bulk volume of fabric at nominal thickness (cm3). In equation (4), C is the porosity of the fabric.Crystallization performance of the fabric was measured using X-ray diffractometer (ARL X'TRA, Switzerland) with the scanning angle 5°–55° and the scanning speed 2°/min, and the crystallinity was calculated using the software Jade.
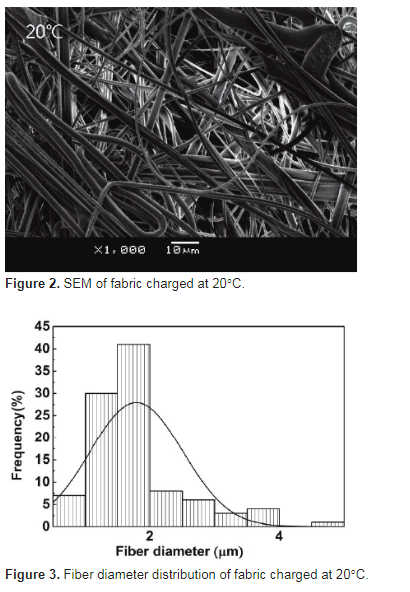
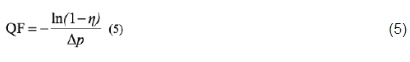
The ltration efciency and the pressure drop of the fabric were evaluated using a custom-design automatic lter tester. The measured fabric area was 100 cm2. The aerogel was sodium chloride with a particle size of 0.3 mm, and the measured ltration rate was 5.33 cm/s (ow rate was 32 L/min). Three measurements were taken for each sample.3. Results and discussions3.1. Fiber diameter of samplesFiber diameter is one of the basic structural parameters of ber-based air lter materials, and it will directly affect the pore size, porosity, and pore structure of the materials, which will affect the ltration efciency and air resistance of the materials [24]. The SEM image and the ber diameter distribution of the fabric charged at 20°C are respectively shown in Figures 2 and 3; we can nd that the ber is ne and the ber diameter in the range of 1–2 mm accounts for 75%.
It can be seen from Figure 2 that the bers in the melt-blown nonwoven fabric charged at 20°C are disorderly arranged to form a three-dimensional network structure. When the external temperature is applied (Figure 4), the surface morphology of fabrics has a relatively serious phenomenon of melting and agglomeration, and the pore of the three-dimensional structure is blocked, which in some extent destroys the surface structure of fabrics.
3. Results and discussions
3.1. Fiber diameter of samplesFiber diameter is one of the basic structural parameters of ber-based air lter materials, and it will directly affect the pore size, porosity, and pore structure of the materials, which will affect the ltration efciency and air resistance of the materials [24]. The SEM image and the ber diameter distribution of the fabric charged at 20°C are respectively shown in Figures 2 and 3; we can nd that the ber is ne and the ber diameter in the range of 1–2 mm accounts for 75%.
The average diameters are shown in Table 1. No visible change in the ber diameter is found with the increase in the electret temperature. This was because the renement of the ber mainly occurs near the nozzle of the die during the production of the melt-blown nonwoven fabric.
3.2. Pore size and distribution of samplesPark et al. [25] studied the effect of different pore sizes and pore size distribution on ber ltration performance. The results showed that air ltration materials with smaller pore size and uniform pore size distribution have better ltration efciency. As shown in Figure 5, more than 95% of the pore size was mainly concentrated between 3 mm and 14 mm when the fabric was charged at 20°C.Figure 6 displays that temperature treatment broadens the range of the pore size distribution of the fabric from 3–14 mm to 3–17 mm. We can see that all samples have a ner ber diameter (Table 1). Generally, ner bers would form a ner pore size and more uniform pore size distribution; however, during the process of charging at a high temperature (≥70°C), the formed melt-blown nonwoven fabric was heated again and the ner bers were more easily melted; there were many molten beads attached to the ber (Figure 7), resulting in the pore size becoming slightly larger.The mean pore diameters further conrmed the conclusion. All samples charged in the range of 70–110°C have a larger mean pore diameter than those charged at 20°C.
3.3. The thickness and areal weight of samplesAs shown in Table 3, as the electret temperature increased, the thickness rst increased and then decreased, but the variation was not large, between 0.2 and 0.24 mm.As shown in Figure 8, the smallest areal weight of samples charged at 20°C was 18.31 g/m2; the areal weight of samples charged in the range of 70–95°C stayed at approximately 27 g/m2. The areal weight continued to increase when the temperature continued to rise. When the electret temperature was low (at 70°C), the ber shrunk by heat, the width of the fabric became narrow, and the thickness and the areal weight increased. As the temperature continued to rise (>70°C), the shrinking bers continued to melt and became uid adhering to the ber web, which became at after cooling (Figure 4), so the thickness decreased while the areal weight continued to rise.3.4. The porosity of samplesThe porosity of the ber assembly refers to the ratio of the pore diameter inside the ber lter material to the ber body structure. The porosity of the fabric decreased with the increase in the electret temperature (Figure 9). The porosity at 20°C was the highest, reaching 89.94%; the porosity was relatively stable and stayed at approximately 87% when the electret temperature was in the range of 70–95°C. When the temperature continued to rise, the porosity dropped signicantly. For the melt-blown lter material, under the premise of a certain pore size, the porosity will affect the amount of air per unit time, which will affect its pressure drop [26].The change in porosity further conrmed the conclusion, which is also the cause of variations in thickness and areal density with the electret temperature. As shown in Figure 4, when the temperature rises, the shrinking bers continue to melt and adhere to the ber web, which becomes solidied after cooling, and the hole around the melting ber will be blocked. Thus, porosity decreased with increasing temperature.3.5. The crystallinity of samplesThe X-ray images of samples charged at 20–75°C and 100–110 °C are shown in Figures 10 and 11, respectively. The fabric charged at 20°C exhibits four diffraction peaks, which appeared close to diffraction peaks of the 110, 040, 130 and 041 crystal planes of the PP a-crystals in the vicinity of 13.9°, 16.8°, 18.5°, and 22°, respectively [27], indicating the presence of the a-crystals; however, the weak intensity of the diffraction peak indicated that the a-crystals were less. At 70°C, the signal of the diffraction peak became strong, but its peak was not sharp. Starting from 75°C, the diffraction peak of the fabric became sharp, indicating that the a-crystals of the ber were growing. When the temperature was between 100° and 110°C, the diffraction peak became sharper and the a-crystals growth in the ber was perfect.The X-ray patterns of samples are shown in Figure 12, and the corresponding crystallinity is given on the right. It can be observed that the lattice plane (110) appears at around 14.2°. This is in good agreement with the a-crystals. Therefore, we speculate that the bers were predominately crystallized into a-crystals. The crystallinity is 20.56% for the sample charged at 20°C, while the crystallinity of the samples charged at 70, 75, 80, 85, 90, 95, 100, and 110°C are 28.67%, 41.12%, 43.05%, 45.09%, 43.78%, 36.67%, 47.23%, 48.86% and 51.48%, respectively. These results indicate that electret temperature treatment can improve crystallinity.
3.6. Filtration performance3.6.1. Pressure dropAs shown in Figure 13, the pressure drop at 20°C was the lowest. With the increase in temperature, the ltration resistance stayed at approximately 38 Pa.From Figure 14, we can see that the trend of the ber diameter varying with the electret temperature is opposite to the tendency of ltration resistance changing with the electret temperature, that is to say, the pressure drop increased (decreased) when the ber diameter decreased (increased), and this phenomenon corresponds with the theory. We know that the areal density and porosity are two primary factors to affect the ltration resistance of melt-blown lter materials. The pressure drop would increase when the areal weight increased and the porosity decreased. From Figures 15 and 16, we can conclude that the increase in pressure drop is due to the increase in areal weight and the decrease in porosity.3.6.2. Filtration efciencyIn Figure 17, with the increase in temperature, the ltration efciency uctuated up and down; the ltration efciency kept above 96% when the temperature was in the range of 20–105°C and dropped signicantly when the temperature continued to rise.In Figure 18, we can clearly see the change in ber diameter and ltration efciency with the electret temperature. The ltration efciency increased (decreased) when the ber diameter decreased (increased), which also corresponds with the theory. In general, the ltration efciency will decrease with the decrease in thickness and surface density. In the range of 20–105°C, Figure 19 presents that the trend of thickness and ltration efciency almost keeps consistent, except at 80 and 100°C, in which the thickness decreased but the ltration increased. Figure 20 displays that the trend of areal weight and ltration efciency almost keeps consistent, except at 80°C. Combined with Figure 21, we nd that at 20–85°C, the crystallinity increased, and the ltration efciency uctuated up and down. However, as shown in Table 4, we can nd that the difference in ltration efciency between the four samples (70, 75, 80, and 85°C) is very small. We can roughly think that at 20–85°C, the ltration efciency increased with the increase in crystallinity. At 85–95°C, the areal weight remained relatively stable, the thickness decreased, the crystallinity decreased, and the ltration efciency decreased. At 95–105°C, the areal weight remained relatively stable and the thickness decreased, but the crystallinity increased and the ltration efciency increased. On this basis, we can conclude that in the range of 20~–105°C, the change in the ltration efciency has a relationship with the change in the crystal structure caused by the electret temperature.
3.6.3. Quality factorFiltration efciency and pressure drop are a pair of contradictions, so evaluating the ltration performance of air ltration materials requires comprehensive consideration of ltration efciency and ltration resistance. Quality factor (QF) is a balance indicator for evaluating the ltration performance of materials. The specic calculation formula is as follows [28]:
In equation (5), h is the ltration efciency (%) and Δp is the pressure drop (Pa).
It can be known from the above formula that the higher the ltration efciency of the lter material or the lower the ltration resistance, the larger the QF value; the lower the efciency or the greater the resistance, the smaller the QF value. In other words, the greater the QF, the better the ltration performance [29-32].
The QF varies with the electret temperature as shown in Figure 22. We can see that the QF generally tends to decrease with the increase in the electret temperature in the case of comprehensive consideration of ltration efciency and ltration resistance. The QF of fabric charged at room temperature is the highest, the corresponding ltration efciency is 96.17% and the pressure drop is 27.7 Pa. In the samples charged at 70°C–110°C, the QF of the sample treated at 80°C was the largest, the corresponding ltration efciency was 98.35%, and the ltration resistance was 38.7 Pa. We nd that the ltration performance of fabric charged at room temperature was the best in all samples.
4. Conclusions
The results of research on the inuences of electret temperature on the structure of melt-blown PP fabrics exhibited that the electret temperature has no signicant effect on ber diameter, but the range of pore size distribution was broadened and the mean pore diameter was slightly larger. With the electret temperature raised, the porosity decreased while the areal weight increased, and the thickness rst increased then decreased, but the variation was not large. The electret temperature could increase the diffraction peak signal of samples, promote the growth of the alpha crystal, and improve the crystallinity of fabrics.The results of research on the effect of electret temperature on the ltration performance of melt-blown PP fabrics indicated that the pressure drop raised and kept relatively stable because of the decrease in porosity and the increase in areal weight, and the ltration efciency increased (decreased) with the increase (decrease) in crystallinity when charged in the range of 70–105°C. Based on a combined consideration of air ltration efciency and pressure drop, the QF of melt-blown nonwoven fabric treated at the room temperature is the highest, and the ltration performance is the best.
Previous: Methods For The Evaluation Of Abraded Fabrics
N e x t : Mask Filter Efficiency test of Materials and methods
